Introduction: Data Meets Dunking
The Dunker Spreadsheet, created by Ben Hopkins, is a community-driven initiative that collects and organizes performance data from dunkers worldwide. This crowdsourced dataset includes everything from vertical leap numbers to personal goals and strength metrics.
- For example, Ben himself is 6’5.5″, weighs 212 lbs, and has a 41″ max running vertical — all off one foot.
By Dunkers, For Dunkers
Originally built for fun by a data-loving STEM graduate, the spreadsheet has blossomed into a powerful tool for dunkers to compare stats, share goals, and see how their training stacks up. With over 70 contributors, the data provides insight into both individual stories and community-wide patterns.
General Findings: What the Data Shows
From the first 70+ entries, several interesting trends have emerged:
- Average max running vertical is around 39.6 inches, while standing verticals average roughly 32.2 inches.
- Hyrum Fechser from Utah logs an impressive 48.5″ running vertical, while Jason Zhao from Missouri posts a solid 38″ standing vertical.
- Average weight is approximately 175 pounds, with most athletes ranging from 140 to 200 lbs.
- The average training time is just over four years, highlighting both newcomers and long-term veterans.
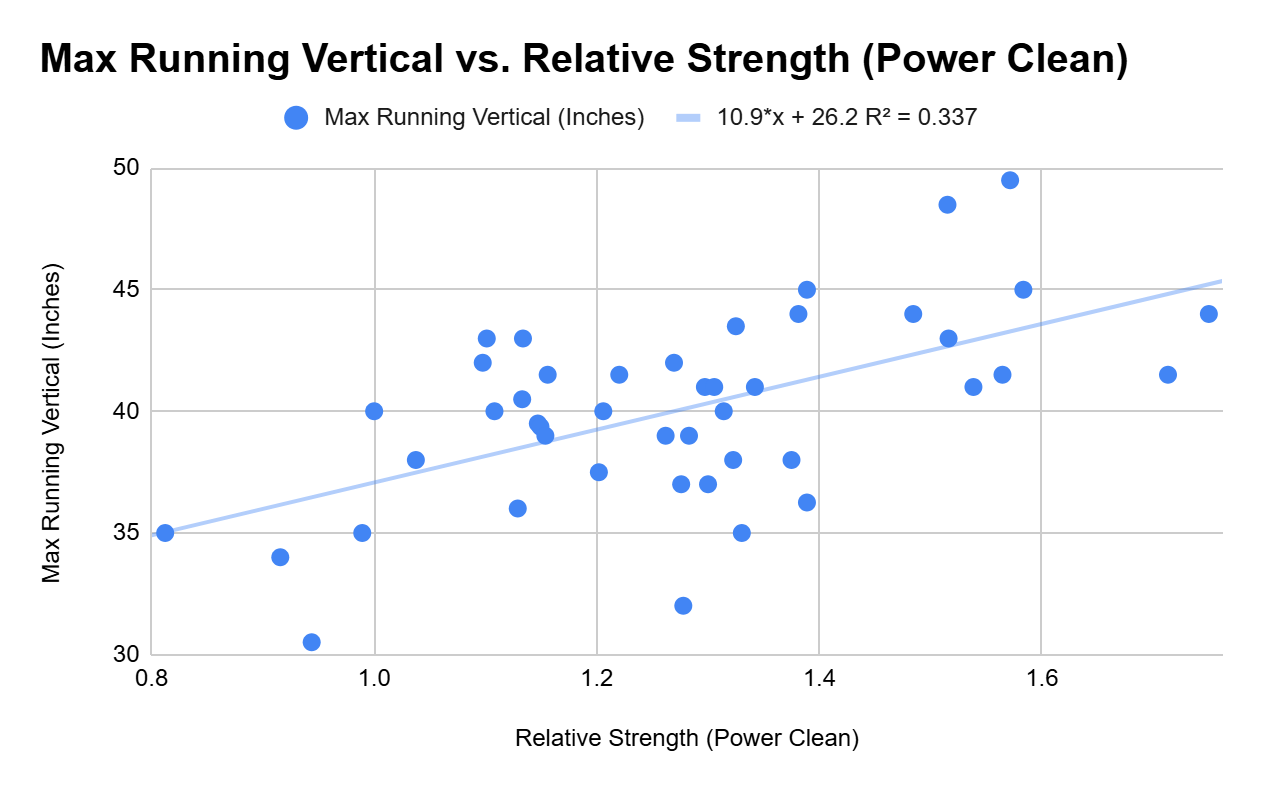
- Relative strength (power clean to body weight ratio) shows a strong correlation with vertical performance, reinforcing the importance of power training.
- Trenton Pierce reports a 44″ max vertical, a 315 lb power clean, and the highest relative strength ratio of 1.75x.
- Common goals include landing specific new dunks like Windmills or Eastbays, and many respondents also express aspirations of going pro.
- @realjaymeeks from Washington says he wants to “start making some type of income from it and travel with my talent,” while Hunter Castona from Wisconsin shares his goals: “Become a pro, get into high-level contests, earn the Black Band, hit Underboth off the backboard, and grow the dunk scene.”
Global Distribution: Mapping the Dunking World
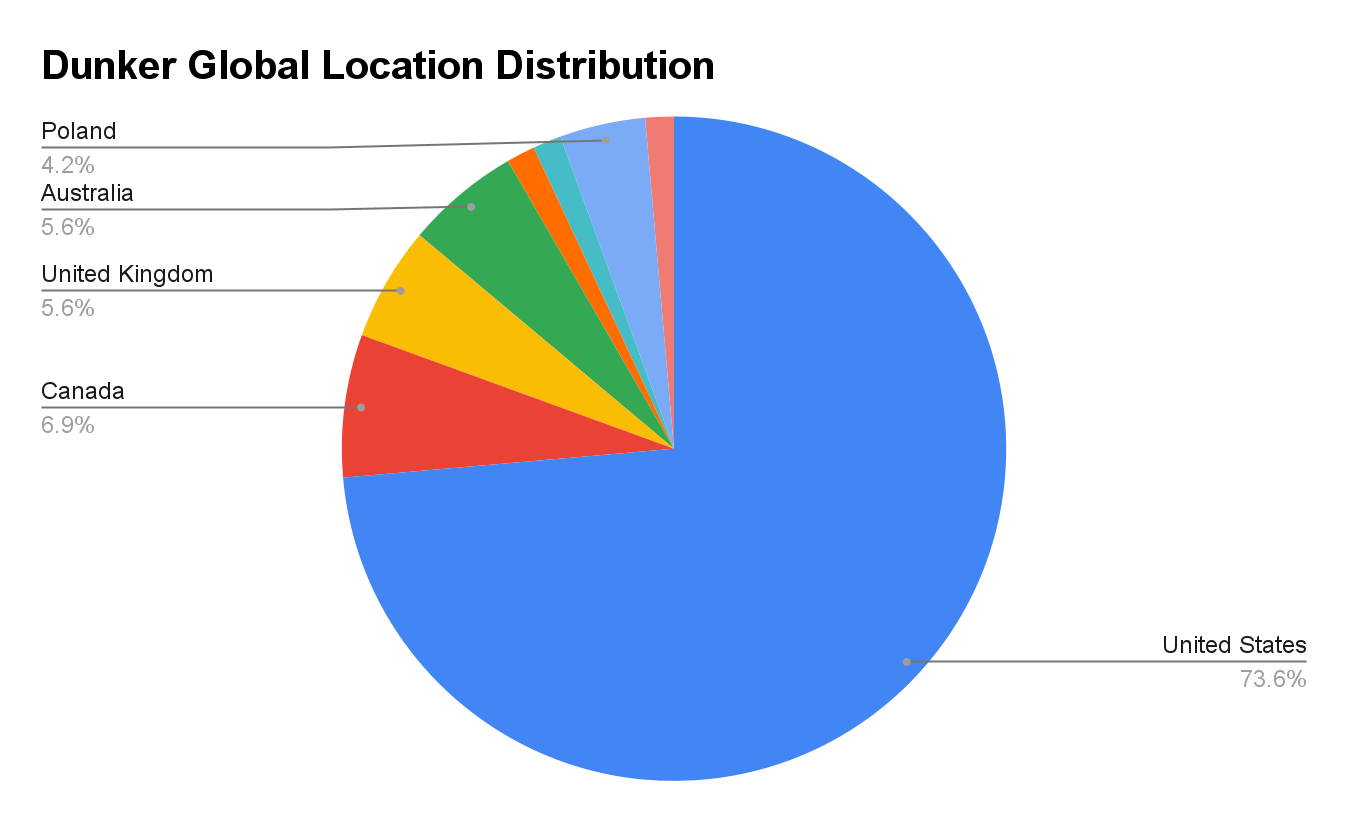
One striking feature of the spreadsheet is its international reach. Contributors come from across North America, Europe, Asia, and Oceania.
Additionally, among U.S.-based respondents, a heatmap of states reveals geographic clusters of dunking activity. States like California, Florida, and Texas appear more frequently, possibly due to population size and basketball culture.
Figure 1.0:

Figure 1.1: Dunker Distribution in the US

Styles: Primary Plant Patterns
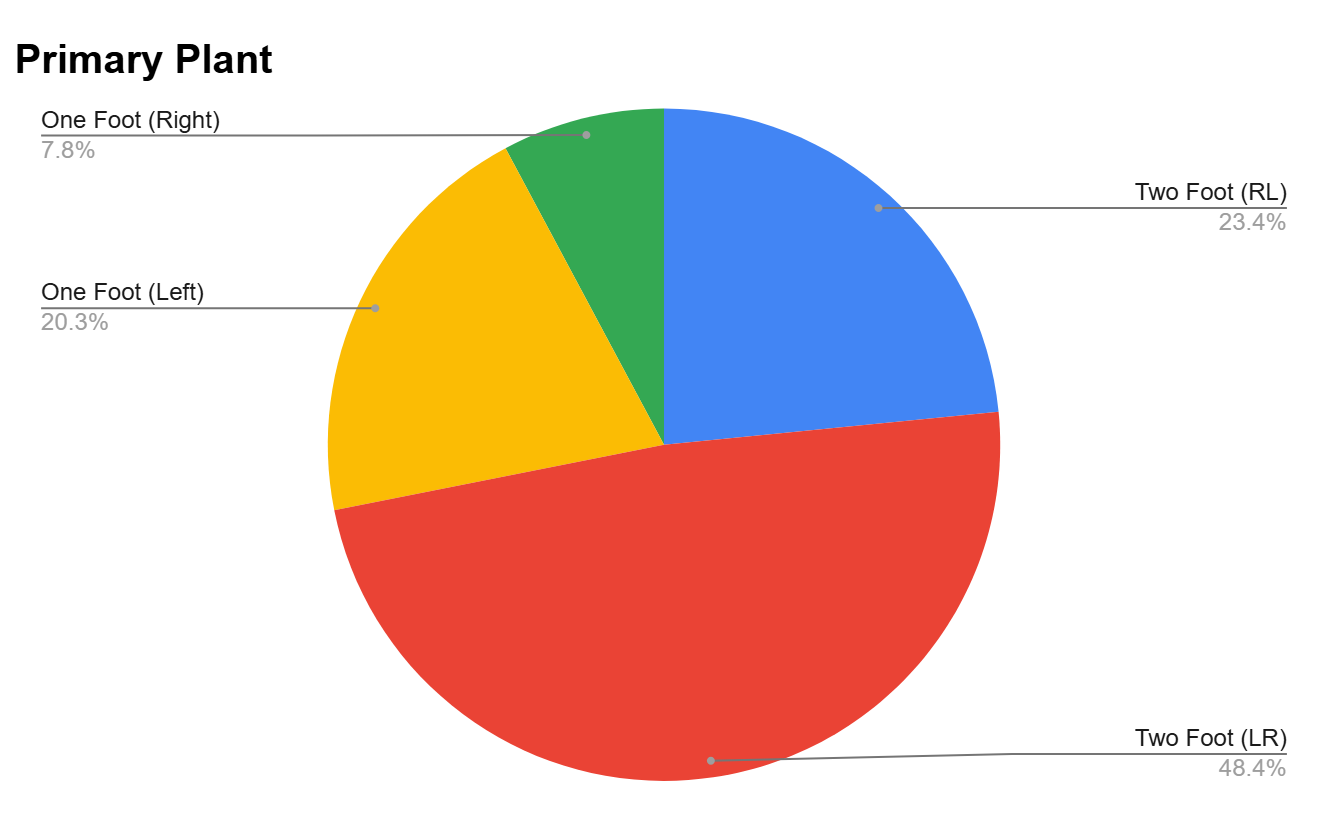
The survey also collects information about each dunker’s primary plant technique. This adds a layer of personal detail to the dataset and reveals interesting jumping style preferences.
The primary plant techniques recorded in the survey include:
- Two-foot (Right-Left)
- Two-foot (Left-Right)
- One-foot Left
- One-foot Right
A bar chart of plant preferences shows that two-foot jumpers dominate, with the LR technique being the most common.
Figure 2.0:

Performance Correlation: Max Running Vertical vs. Relative Strength
One of the more interesting relationships in the data is between relative strength and vertical performance. Relative strength is calculated by dividing a dunker’s one-rep max (e.g., power clean) by their body weight. When charted against max running vertical, a positive trend appears, suggesting that increased relative strength generally coincides with better jump performance.
- Jordan Kilganon has one of the top all-around profiles — a 49.5″ vertical, 285 lb clean, and a relative strength ratio above 1.6x.
Figure 3.0:

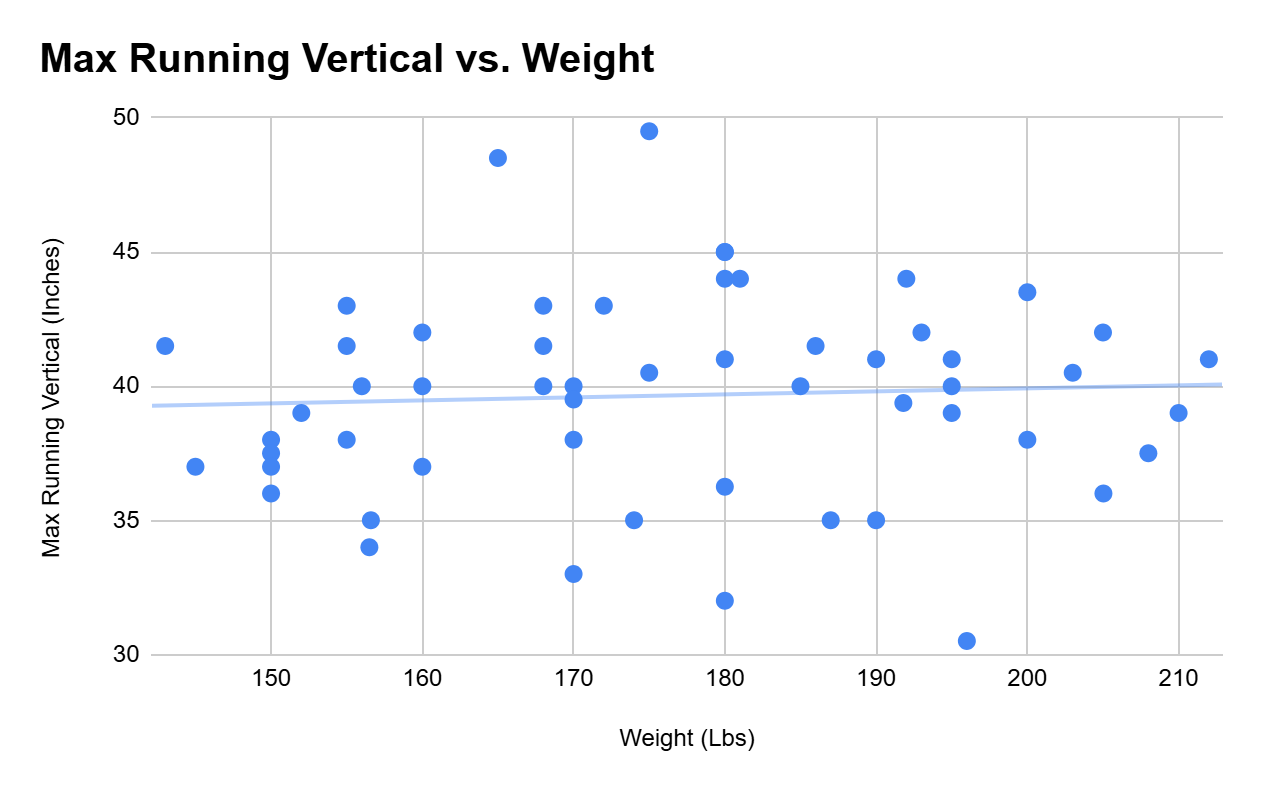
Max Vertical vs. Body Weight
Another compelling chart explores how body weight affects vertical leap. While conventional wisdom suggests heavier dunkers should struggle more, the spreadsheet shows many athletes jumping 40+ inches across a wide weight range.
- For example, Josh Ruble in Missouri weighs 192 lbs and still hits around a 44″ vertical, while Finn Addy from Canada, weighing 168 lbs, reaches 43″.
This demonstrates that high verticals can come from both light flyers and strength-focused athletes
Figure 4.0:

Conclusion: What This Project Really Shows
The Dunker Spreadsheet isn’t trying to be a definitive or scientifically rigorous study — and that’s the point. It’s a fun, evolving project built by and for dunkers who want to see where they stand, track their progress, and learn from others.
From correlations in strength and vertical to surprising outliers and common goals, it offers a snapshot of what’s happening in the dunk world right now. It highlights the individuality in how people train, jump, and grow.
Get Involved: Take the Survey or Explore the Data
If you’re a dunker or aspiring jumper, you can take the survey and explore the full spreadsheet.To support the creator of the Dunker Spreadsheet and stay updated on future developments, follow @BenBounces on Instagram, TikTok, or YouTube.